HAZARD to HARM
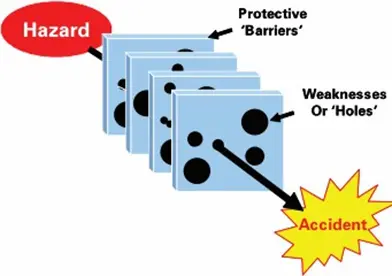
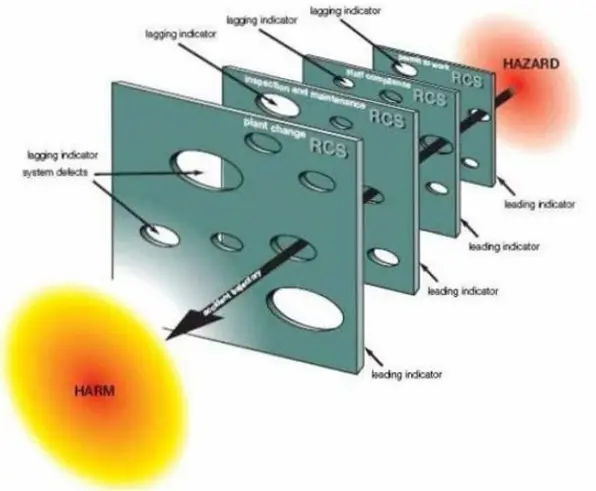
Hazards are contained by multiple protective barriers. These Barriers may have weaknesses or holes’ When holes align, the hazard passes through the barriers resulting in the potential for adverse consequences.
Barriers may be physical engineered containment or behavioral controls dependent on people. Whereas Holes can be latent/incipient, or actively opened by people


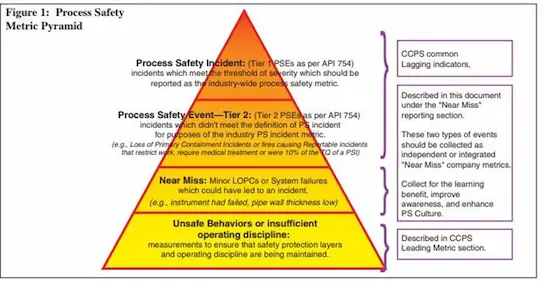
Accident pyramid – Heinrich’s model
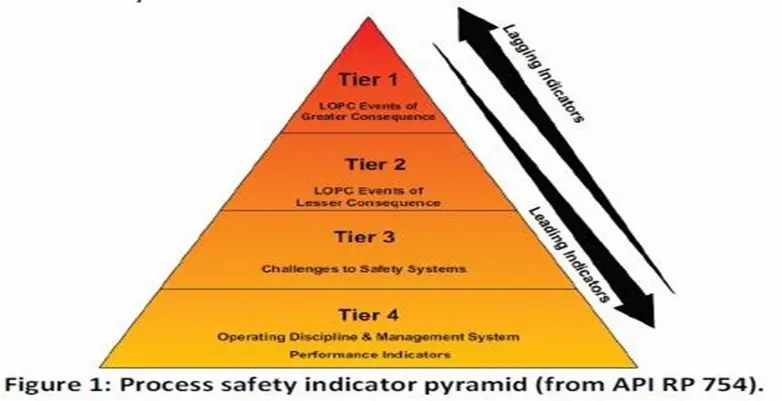
- Tier 1 is the most lagging and Tier 4 is the most leading.
- Tiers 1 and 2 are more lagging and cover asset integrity major and less severe incidents.
- Tiers 3 and 4 provide more leading measures. The indicators are intended to be much specific to the company’s management system and often will be specific to a particular activity or to an individual asset, facility of plant.
- Tiers 1 & 2 are RP- 754 standardized
- definitions.
- Tiers 3 & 4 are company defined Performance indicators.

- The accident pyramid represents two key concepts.
- One is that safety accidents can be placed on a scale representing the level of consequence.
- The second is that many precursor incidents occurred with lesser consequences for each accident that occurred with greater consequences.
- Heinrich’s model represents a predictive relationship between lower and higher
- consequences personal safety events.
- It is believed that a similar predictive relationship exists between lower and higher consequence events that relate to process safety.

Key Performance Indicators
Leading indicators:
- Indicators that are predictive are considered leading indicators and may be used to identify a weakness that can be corrected before a higher consequence event occurs.
- Tend to be forward-looking and indicate the performance of the key work processes, operating discipline, or protective barriers that prevent incidents.
- They are designed to give an indication of potential problems or deterioration in key safety systems early enough that corrective actions may be taken.
Lagging indicators:
- Tend to be outcome-oriented and retrospective.
- They describe events that have already occurred and may indicate potential recurring problems and may include fires, releases, and explosions.
Guidelines for Selection of Process Safety Indicators
- Provides a high-level overview of some key aspects of process safety indicator selection.
- Use process hazard evaluation and risk assessment findings to identify potential high impact events and the process safety barriers intended to prevent such incidents.
- What are the consequences?
- What is the likelihood?
- Which are the most critical barriers?
- Use process hazard evaluation and risk assessment findings to identify potential high impact events and the process safety barriers intended to prevent such incidents.
- Involving employees and employee representatives, process safety professionals, and engineers in the identification process can yield a more complete picture of process safety performance that will aid in indicators selection.
- Selecting appropriate indicators using unbiased and broad-based input will lead to a high-performing program
Tier 1 Performance Indicator – Process Safety Event (T-1 PSE)
The count of Tier 1 process safety events is the most lagging performance indicator and represents incidents with greater consequence resulting from actual losses of containment due to weaknesses in the barriers. When used in conjunction with lower tier indicators, it can provide an assessment of the process safety performance
Criteria for Selection of Tier 1 & 2 Process Safety Indicators
Indicators should be:
- Objective, few and simple.
- Well defined, capable of being applied consistently across the industry.
- Useful to drive process safety performance improvement and learning.
Events associated with the following activities fall outside the scope of this RP:
- Releases from pipeline transfer operations occurring outside the process or storage facility fence line;
- Marine transport operations, except when the vessel is connected to the process for the purposes of feedstock or product transfer;
- Truck or rail operations, except when the vessel is connected to the process for the purposes of feedstock or product transfer, or if the truck or rail car is being used for on site storage;
- Vacuum truck operations, except on-site truck loading or discharging operations, or use of the vacuum truck transfer pump;
- Routine emissions that are allowable under permit or regulation;
- Office, shop and warehouse building events (e.g. office fires, spills, personnel injury or illness, etc.)
- Personal safety events (e.g. slips, trips, falls) that are not directly associated with on-site response to a loss of primary containment (LOPC) event;
- LOPC events from ancillary equipment not connected to the process (e.g. small sample containers);
- Quality assurance (QA), quality control (QC) and research and development (R&D) laboratories (pilot plants are within RP scope);
- Retail service stations & On-site fueling operations of mobile and stationary equipment (e.g. pick-up trucks, diesel generators, and heavy equipment)
Tier 1 & 2 Process Safety Events always start with Loss of Primary Containment
- Loss of Primary Containment: An unplanned or uncontrolled release of material from Primary Containment, including non-toxic and non-flammable materials (e.g. steam, hot condensate, nitrogen or compressed air)
- Secondary Containment: Exists to contain or control a release from primary containment. Secondary containment systems include tank dikes, curbing around process equipment, drainage collection systems, the outer wall of double walled tanks, etc.
- Primary Containment: A tank, vessel, pipe, truck, rail car or equipment intended to serve as the primary container or used for processing or transfer of material.
- An unplanned or uncontrolled release of material, including non-toxic and nonflammable materials, from a process which results in one or more of the consequences
- A location which results in a potential hazard, such as the formation of flammable mixtures at grade level or on elevated structures, or exposure of personnel to toxic vapors or corrosive chemicals.
UNDGL & GHS désignations for Flammable Liquids & Gases
- Flammable Gases and Liquids with IBP < 35°C
- Hydrogen, Methane, Ethane, LPG, Ethylene, isopentane
- Flammable Liquids with IBP > 35°C and FP < 23°C
- N-pentane, cyclopentane, hexane, cyclohexane, gasoline / petrol, toluene, o-xylene (but not meta or para-xylene), MTBE, ethanol, some crude oils
- Flammable Liquids with FP > 23°C and ≤ 60°C
- Diesel fuel, most kerosenes, p-xylene, n-butanol, isobutanol, some crude oils
- Flammable Liquids with FP > 60°C
- Most asphalts, tars, molten sulfur (160°C), ethylene glycol (110°C), propylene glycol (99°C) – (Must be released above Flash Point for Tier 1)
- Calculation of Tier 1 PSE Rate
- The Tier 1 PSE Rate shall be calculated as follows:
- Tier 1 PSE Rate = (Total Tier 1 PSE Count / Total Work Hours) × 200,000
Tier 2 Performance Indicator -Process Safety Event (T-2 PSE)
Tier 2 Indicator Purpose
- A Tier 2 Process Safety Event (T-2 PSE) is a LOPC with lesser consequence.
- A T-2 PSE is an unplanned or uncontrolled release of any material, including non-toxic and non-flammable materials (e.g.steam, hot condensate, nitrogen, compressed CO2 or compressed air), from a process that results in one or more of the consequences listed below and not reported in Tier 1:
- An employee, contractor or subcontractor recordable injury;
- A fire or explosion resulting in greater than or equal to $2,500 of direct cost to the Company;
- A pressure relief device (PRD) discharge to atmosphere whether directly or via a downstream destructive device that results in one or more of the following four consequences:
- liquid carryover;
- Discharge to a potentially unsafe location;
- An on-site shelter-in-place
- Public protective measures (e.g. road closure); and a PRD discharge quantity greater than the threshold quantity in Table 2 in any one hour period
- A release of material greater than the threshold quantities described in Table 2 in any one hour period.
- Calculation of Tier 2 PSE Rate
The Tier 2 PSE rate shall be calculated as follows: Tier 2 PSE Rate = (Total Tier 2 PSE Count / Total Work Hours) x 200,00
Tier 3 Performance Indicator – Process Safety Event (T-3 PSE) – Challenges to Safety Systems
Tier 3 Indicator Purpose
- A Tier 3 PSE typically represents a challenge to the barrier system that progressed along the path to harm, but is stopped short of a Tier 1 or Tier 2 LOPC consequence.
- Indicators at this level provide an additional opportunity to identify and correct weaknesses within the barrier system.
- Tier 3 indicators are intended for internal Company use and can be used for local (site) public reporting. Some of theexample indicators below:
- Safe operating limit excursions;
- Prima
Tier 4 Performance Indicator—Process Safety Event (T-4 PSE) – Operating Discipline & Management System
Tier 4 Indicator Purpose
- Tier 4 indicators typically represent performance of individual components of the barrier system and are comprised of operating discipline and management system performance.
- Indicators at this level provide an opportunity to identify and correct isolated system weaknesses.
- Tier 4 indicators are indicative of process safety system weaknesses that may contribute to future Tier 1 or Tier 2 PSEs.
- Tier 4 indicators may identify opportunities for both learning and systems improvement.
- Tier 4 indicators are intended for internal Company use and for local (site) reporting.
- Procedures Current and Accurate.
- Work Permit Compliance.
- Safety Critical Equipment Inspection.
- Safety Critical Equipment Deficiency Management.
- Management of Change (MOC) and Pre Start-up Safety Review (PSSR) Compliance.
- Completion of Emergency Response Drills.
- Fatigue Risk Management , or identify others that are meaningful to its operations.
Company shall develop and use Tier 4 performance indicators. Companies may use all or some of the example indicator topics below
- Process Hazard Evaluations Completion.
- Process Safety Action Item Closure.
- Training Completed on Schedule
