The 3D Fire and Gas mapping study is carried out to help in decision making process for locating the number of Gas and flame detectors. The fire and gas detection systems are provided on installations for prior identification of the risk from the accidental toxic and flammable gas release. The risk from flammable or toxic gas releases or fires can be reduced by early detection and subsequent mitigating actions.
OBJECTIVES
- Identifying all potential hazards that will lead to flammable gas (Natural gas) release or ignition present in the site.
- Determination of the characteristics of the likely gas release by modelling the physical effect and consequently quantifying the extent of hazardous scenario on the project facilities and proposing new fire and gas detection arrange.
SCOPE OF WORK
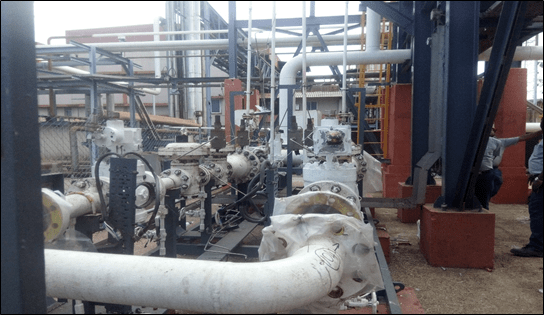
Eleven (11) Natural Gas handling areas including Pressure reducing station, SRV area, Heater area, Primary reformer area, Combustion chamber area, Dryer area, Filter area, Boiler area of 3 units in the site is covered for the Fire and Gas Mapping Study.
The dispersion pattern was analysed to identify the location and mounting height of the detectors. Further, an overall Gas detection layout plan with the location, type and number of detectors was provided using the 3D modelling software.
METHODOLOGY
Step 1: Hazardous Area Identification
Natural gas handling areas are critically assessed for identifying all hazardous areas that are present in the location into different hazardous zones.
Step 2: Hazardous Area Characterization
From the hazardous area identification, major accident hazards are characterized based on the likelihood and frequency of the incident and based on the properties and Natural gas quantity released.
Step 3: Risk Volume Definition
A representative leak size is selected based on the standards for all the loss of containment scenarios isolated in step-2.
Step 4: Determination of characteristic cloud for detection
The identified scenarios are modelled using software to calculate the impact distance in downwind and crosswind direction at prevalent wind conditions at the location.
Step 5: 3D Modelling
A hybrid approach of scenario based and geographic based approach has been followed for 3D modelling. The advantage of this approach is that number of detectors required will be comparatively less with the better coverage results. The drawing file (3D) is imported to the software and the hydrocarbon/toxic detectors are placed near the loss of containment scenarios or potentially hazardous areas based on the outputs from the above steps.
Step 6: Coverage Mapping
Detector and impact distance calculated will be overlaid on the 3D map to check if the detectors are at adequate location to sense and detect the likely fire and gas dispersion at that location.
Step 7: Optimization/Detector Layout Definition
Repeat the above steps for all loss of containment scenarios. Optimize the detector location height or change the place of detector location to match the dispersion coverage of the hydrocarbon /toxic release if the detectors are found inadequate to sense or detect the dispersion.